Manual reporting in property management has traditionally relied on exporting spreadsheets, cleaning datasets, and formatting recurring financial and operational reports from platforms like Entrata. For teams managing multiple properties, this process becomes a major operational bottleneck—often consuming hours each week per user.
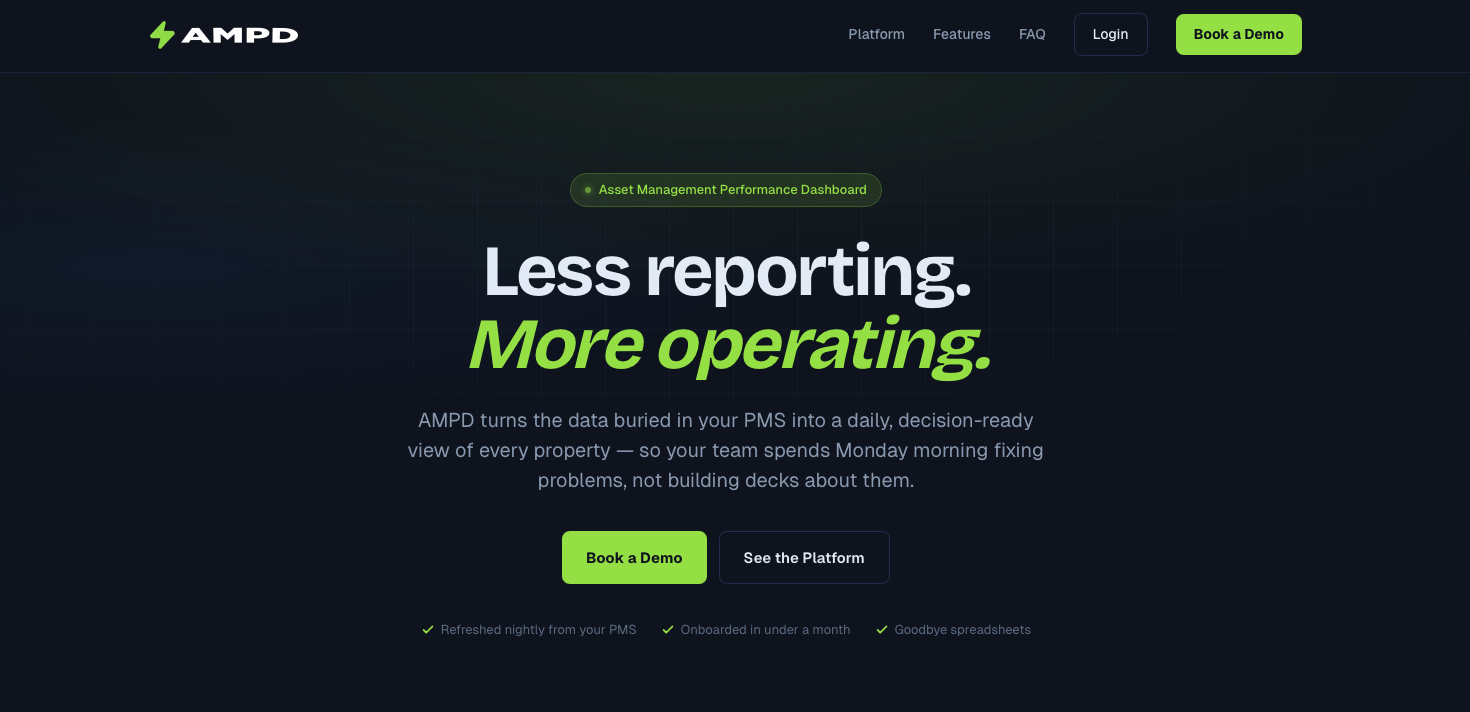
In a recent implementation with AMPD, we focused on eliminating this friction by replacing spreadsheet-based workflows with real-time, visual reporting dashboards that surface key metrics instantly.
The Problem: Spreadsheet-Driven Reporting in Entrata
Before AMPD, teams working in Entrata followed a familiar but inefficient workflow:
- Export raw data from Entrata reports
- Clean and normalize multiple spreadsheet formats
- Manually build pivot tables and summaries
- Reconcile inconsistencies across properties
- Recreate the same reporting structure weekly or monthly
While Entrata provides robust reporting capabilities, many organizations still rely on external spreadsheet manipulation to achieve the level of customization and visualization required by executives and asset managers.
This created three core issues:
- High labor cost due to repetitive formatting work
- Delayed insights caused by manual processing cycles
- Inconsistent reporting structures across teams and properties
The Solution: Real-Time Visual Reporting with AMPD
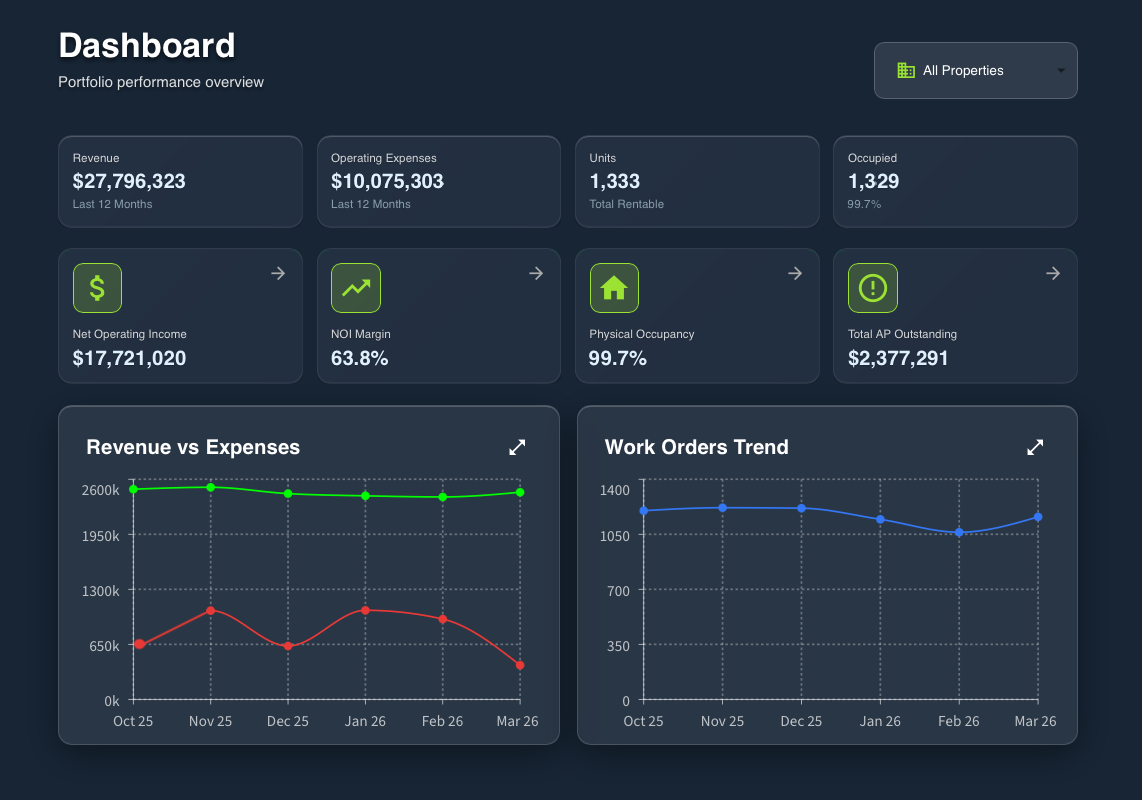
AMPD introduced a direct layer on top of Entrata data that eliminated manual spreadsheet workflows entirely. Instead of exporting and rebuilding reports, users now access:
- Pre-aggregated financial and operational metrics
- Real-time occupancy and revenue tracking
- Portfolio-level performance comparisons
- Visual dashboards tailored for different roles (leasing, asset management, executive)
The key shift was moving from data extraction → manual formatting → interpretation to direct visualization and decision-making.
Impact: 90% Reduction in Manual Reporting Time
After implementing AMPD, teams reported an approximate 90% reduction in time spent on manual reporting tasks.
This reduction came from eliminating several repetitive steps:
- No more exporting recurring Entrata reports
- No manual spreadsheet formatting or pivot table creation
- No duplicate reporting templates across teams
- No reconciliation between multiple data sources
Instead, users now rely on live dashboards that refresh automatically and standardize reporting logic across the organization.
Operational Changes Across Teams
The shift to AMPD-driven reporting also changed how teams interact with data:
- Asset managers moved from monthly static reports to continuous performance monitoring
- Leasing teams accessed occupancy and conversion data without requesting custom reports
- Executives gained immediate portfolio visibility without waiting for compiled summaries
Conclusion
By integrating directly with Entrata and replacing spreadsheet-heavy workflows with AMPD’s visual analytics layer, reporting time was reduced by 90% while improving consistency and decision speed.
The core transformation was not just automation—it was the removal of manual interpretation steps between data and insight.